

A musician’s campaign report must link ad activity to downstream listener quality using a declared attribution window, usually 30 to 60 days. That single rule separates useful campaign reporting for musicians from vanity metrics. Twisby Records and platforms like Spotify for Artists both build their reporting around this delay, because streaming behavior and algorithmic lift take time to show up. This guide covers the KPIs, the data stack, how to read the numbers, and how often to check them.
TL;DR:
- Tracking downstream listener engagement requires at least a 30 to 60-day attribution window due to delays in streaming platform signals.
- Key downstream KPIs include saves, streams per listener, playlist adds, followers gained, and profile visits, which indicate music landing with the right audience.
- A simple data stack—ad platform, smart links, streaming platforms, and a spreadsheet—is sufficient for effective analysis, with daily merging of data.
- Focus on cost per save and audience segments rather than raw streams or clicks to assess campaign quality and optimize future targeting.
- Avoid judging campaigns too early and ensure consistent tagging, demographic analysis, and integration of social media results for accurate, actionable insights.
Table of Contents
- What KPIs Should a Campaign Report Include?
- How Do You Collect and Connect Campaign Data?
- How Do You Interpret Results and Judge Success?
- What Cadence and Dashboard Should You Use?
- How to Segment and Analyze Data by Audience Demographics and Geography
- How Do You Integrate Social Media and Other Marketing Into the Report?
- How Do You Set Realistic Benchmarks by Genre and Market?
- How Do You Use Reports to Optimize Future Budgets?
- What Mistakes Do Musicians Make in Campaign Reporting?
- Twisby Records’ Approach to Campaign Reporting
- Twisby Records: Managed Reporting and Advertising for Independent Artists
- Primary Sources and Tools
- Sources
- FAQ
What KPIs Should a Campaign Report Include?
Every music marketing report needs two categories of numbers: ones that measure the ad itself, and ones that measure what happened after someone heard your music. Mixing them together is how artists convince themselves a campaign worked when it just got cheap clicks.
Ad-read metrics (early signals):
- Impressions — how many times the ad appeared. Tells you almost nothing about quality on its own.
- Clicks — taps on the ad creative.
- Click-outs — the subset of clicks that actually landed on Spotify, Apple Music, or a smart link. This is your real funnel entry point.
Streaming-read metrics (downstream signals):
- Listeners — unique people who streamed at least once.
- Streams — total plays, which can be inflated by a handful of repeat listeners.
- Streams per listener — a far better quality signal than raw stream count.
- Saves and save rate — the percentage of listeners who saved the track, a strong predictor of algorithmic attention.
- Followers gained and playlist adds — longer-horizon signals tied to catalog growth.
- Profile visits — shows whether the ad drove curiosity beyond the single track.
Click-outs and impressions tell you whether the ad itself is working. Saves, streams-per-listener, and playlist adds tell you whether the music is landing with the right people, which is what streaming platforms reward with organic placement. A high click-out rate with a weak save rate usually means the creative is attracting the wrong crowd, not that the campaign failed outright. Benchmarks vary heavily by genre and channel, so treat any range as a starting point, not a verdict, and recalibrate after your first two or three campaigns.
How Do You Collect and Connect Campaign Data?
Independent artists don’t need an enterprise analytics stack. A minimal, disciplined setup beats a complicated one almost every time, mainly because it’s easier to check daily without burning out.
The stack:
- An ad platform: Meta Ads Manager or TikTok Ads Manager for spend, clicks, and audience data.
- A smart link service (categories like ToneDen, Feature.fm, or Hypeddit) that sits between the ad click and the streaming platform.
- Spotify for Artists and Apple Music for Artists for listener, stream, and save data.
- A spreadsheet or Notion database where you merge everything daily.
Smart links matter more than most artists assume. A music marketing funnel separates ad clicks from what actually happens on the streaming platform, and a smart link creates the missing attribution step between the two. Without it, you’re guessing which ad drove which stream.
For landing pages, install both a browser pixel and server-side event tracking (CAPI on Meta). Browser-only pixels lose a meaningful share of events to ad blockers and privacy settings, while server-side deduplication keeps click-out counts closer to reality.
Tag every ad with consistent UTM parameters (campaign, ad set, creative) so you can trace results back to the exact variant that drove them. Then log spend, clicks, and click-outs daily into your spreadsheet, and pull streaming numbers every 24 to 48 hours during an active campaign.
Pro Tip: Build one tab per campaign with a date column running down the side. Missing even two days of logs makes it nearly impossible to reconstruct what happened when you sit down for the postmortem.
How Do You Interpret Results and Judge Success?
The single biggest mistake in campaign reporting for musicians is judging results on day one. Royalties and algorithmic effects don’t move on the same clock as ad spend.
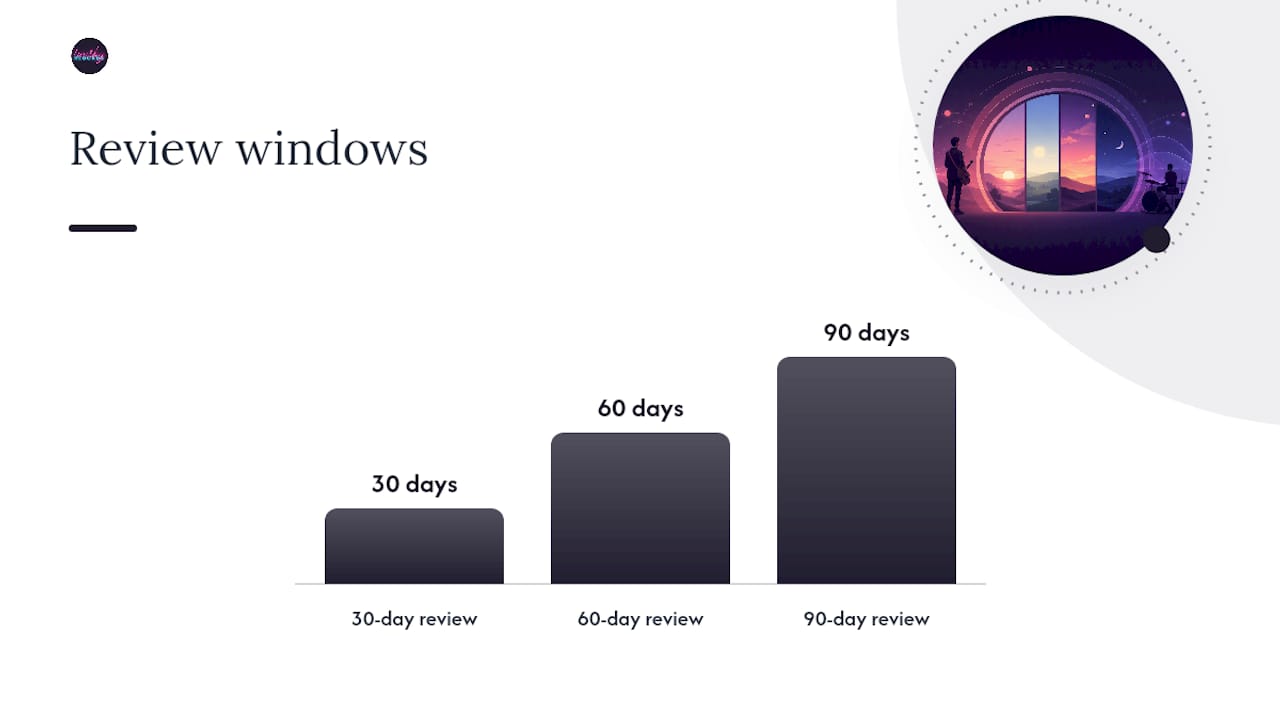
Declare your attribution window before the campaign starts, not after you see the numbers. Industry guidance points to 30 to 60 or even 90 day windows, because algorithmic effects often peak two to four weeks after the ad spend actually stops. Report early results as an “ad read” and treat anything before that window closes as provisional.
A 30-day and 60-day review captures most of the algorithmic movement from a campaign; tracking out to 90 days catches delayed playlist adds and the actual financial read, since royalty statements lag stream activity by weeks.
Four cost metrics do most of the decision-making work:
- Cost per click-out (CPCO): ad spend divided by click-outs. Your earliest health check.
- Cost per listener (CPL): spend divided by unique listeners. Tells you what it costs to reach a new person, not just a click.
- Cost per save (CPSave): spend divided by saves. One of the strongest quality signals available, since saves correlate with algorithmic amplification.
- Cost per stream (CPS): spend divided by total streams. Useful, but easy to game with repeat plays from a small audience.
Don’t assume ad spend recoups as royalties any time soon. A realistic ROI model keeps the early ad read (cost per click-out) separate from the later financial read (royalty payout), because campaigns can generate plenty of streams while still running far behind on direct revenue for weeks.
Set simple action rules before you need them: pause an ad set if CPSave runs well above your target for three or four consecutive days, rotate creative if click-through rate drops sharply week over week, and reallocate budget toward whichever audience segment is producing the lowest CPL. Where possible, run a lift comparison, meaning: compare streams and saves during the campaign against a comparable pre-campaign baseline, rather than trusting direct attribution numbers alone. Direct attribution misses organic spillover that ads often trigger.
What Cadence and Dashboard Should You Use?
Reporting on a fixed schedule keeps you from reacting to noise. A workable rhythm:
- 48 hour smoke check — confirm tracking is firing, spend is pacing, and nothing is broken.
- 7 day creative read — compare click-through rate and CPCO across ad variants.
- 30 day postmortem — the first real read on saves, streams-per-listener, and CPSave.
- 60 day algorithmic review — check playlist adds and follower growth, since this is when Spotify’s own signals tend to settle.
- 90 day financial read — reconcile royalty statements against total spend.
A minimal dashboard needs only these columns, and they translate directly into a spreadsheet: date, daily spend, click-outs, new listeners, saves, streams-per-listener, CPSave, and top-performing creative or audience.
At each postmortem, answer five questions drawn from a structured post-release review: what was the immediate (Tier 1) return; what was the algorithmic (Tier 2) impact; which creatives or audiences outperformed; what should change for the next release; and what percentage of campaign-acquired listeners returned when you released again.
How to Segment and Analyze Data by Audience Demographics and Geography
Aggregate numbers hide the campaigns that are actually working. Breaking results down by age, gender, and location almost always reveals that one or two segments are carrying the whole report.
Pull demographic breakdowns directly from Meta Ads Manager and cross-reference them against the listener location data in Spotify for Artists. If your ad spend skews toward listeners age 18 to 24 in a handful of major cities, but your saves are actually concentrated among a 25 to 34 audience in smaller metro areas, that mismatch tells you exactly where to shift budget next.
Geography matters just as much for genre-specific reasons. A regional country artist might see strong CPL in the Southeast and terrible numbers everywhere else, while an electronic artist could find that a handful of international cities outperform every domestic market combined. Break your dashboard into regional tabs rather than one blended national view, and check whether your best-performing geography also has the best save rate, not just the cheapest clicks. A cheap click from the wrong region is still a wasted click.
When you find a segment with strong streams-per-listener and save rate, treat it as your core audience for future targeting, and use the weaker segments to inform what your next release’s creative or messaging should avoid.
How Do You Integrate Social Media and Other Marketing Into the Report?
A campaign report that only covers paid ads misses half the picture. Organic posts, influencer mentions, and playlist pitching all move the same listener numbers your ads are trying to move, and separating them out tells you what’s actually driving results.
Add a simple source column to your dashboard for every listener spike: paid ad, organic post, playlist placement, or press mention. Cross-check the timing of Instagram or TikTok posts against jumps in Spotify for Artists listener counts. If a spike lines up with an organic post rather than an active ad set, that’s a signal your creative direction is resonating even without paid reach behind it, and it should inform your next ad’s messaging.
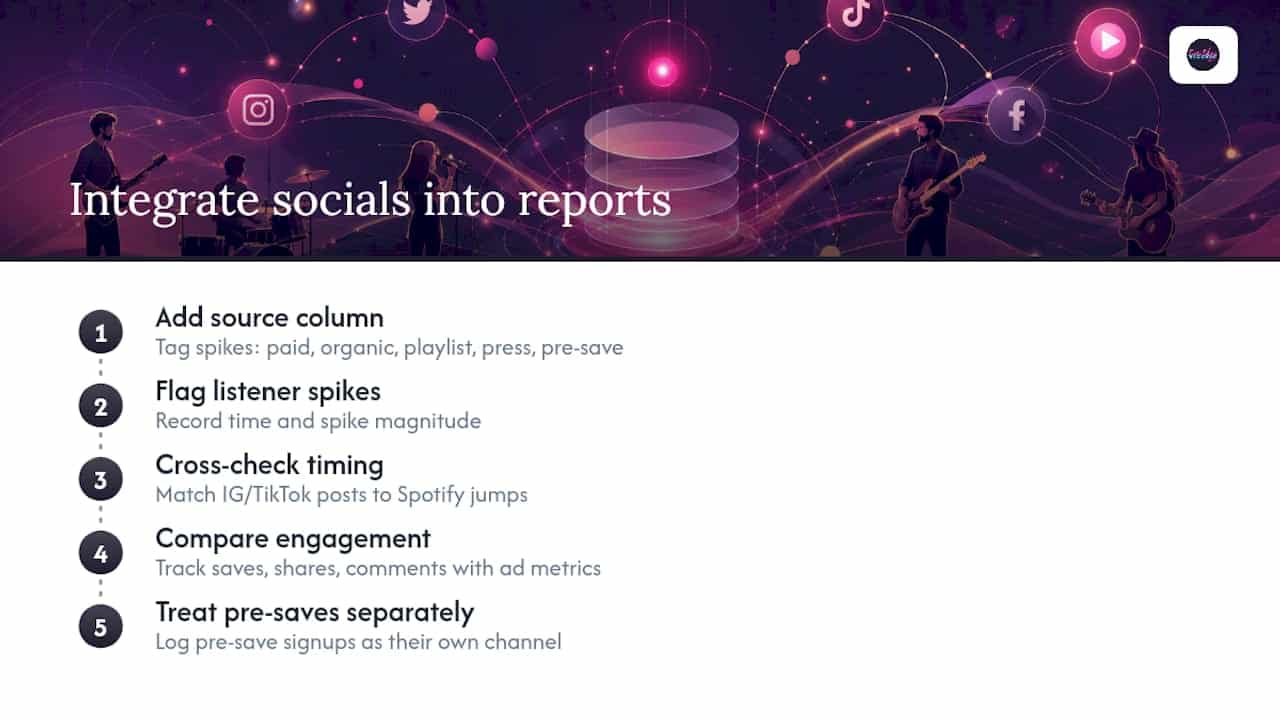
Track social engagement (saves, shares, comments) alongside your ad metrics rather than in a separate report. A song that’s getting shared organically on TikTok while an ad campaign runs for it is usually a much stronger candidate for scaled ad spend than one that only moves when you’re paying for clicks.
Don’t forget email and pre-save campaigns either. A Spotify pre-save campaign often front-loads streams on release day, which can distort your early attribution numbers if you’re not tracking pre-save signups as a separate acquisition channel from paid ad click-outs.
How Do You Set Realistic Benchmarks by Genre and Market?
Generic benchmarks fail because a pop release in a major market and a folk release in a regional one operate under completely different cost structures. Setting goals without accounting for that mismatch sets artists up to misjudge a perfectly healthy campaign as a failure.
Start by looking at your own genre’s typical engagement pattern rather than an industry-wide average. Genres with high replay value, like hip-hop or electronic, tend to post stronger streams-per-listener numbers than genres built around single-listen storytelling, like folk or singer-songwriter work. That doesn’t mean one genre is performing better. It means the metric means something different in each context.
Market size changes the math too. A campaign targeting a dense metro market will usually show a lower cost per click-out than one targeting a smaller regional market, simply because of ad auction competition. Don’t compare your CPL against a benchmark pulled from a different market tier without adjusting expectations.
The most reliable approach is building your own baseline from your first two or three campaigns, then setting each new campaign’s goals relative to that baseline rather than an outside number. If your last campaign ran a $2.50 cost per save, treat $2.25 as a stretch goal for the next one instead of chasing a number pulled from an unrelated genre and market combination. Genre and market context should shape every benchmark you set, not override the trend line you’re building on your own data.
How Do You Use Reports to Optimize Future Budgets?
A campaign report only earns its keep when it changes what happens next. If the same budget split and the same creative approach show up campaign after campaign, the reporting process isn’t doing its job.
Start every new campaign by pulling your last postmortem and identifying the two or three variables that most affected cost per save: audience segment, creative format, or platform. Increase budget allocation toward whichever variable produced the strongest downstream numbers, not just the cheapest clicks. A budget built around last campaign’s actual performance beats one built around a flat percentage increase.
Use the algorithmic review (day 30 to 60) to decide whether a track deserves continued paid support or whether the budget is better spent introducing a new release. Tracks with strong save rates and playlist momentum often justify a second, smaller flight of ads weeks after the initial push, since the algorithmic lift compounds when reinforced early.
Compare platform performance across campaigns too. If Instagram ads consistently produce a lower CPL than a comparable Meta feed placement for your audience, shift future budget accordingly instead of splitting spend evenly out of habit. Over three or four release cycles, this turns campaign reporting into a genuine budget-planning tool instead of a scoreboard you check once and forget.
What Mistakes Do Musicians Make in Campaign Reporting?
Most reporting failures come from the same handful of habits, and they’re avoidable once you know to watch for them.
Judging a campaign on day one or two. Streams and saves lag ad spend, sometimes by weeks. A campaign that looks flat on day three can look strong by day 30.
Reporting total streams without streams-per-listener. A track with 10,000 streams from 200 listeners is a very different result from 10,000 streams across 5,000 listeners, even though the headline number looks identical.
Skipping UTM tagging. Without consistent tags, you can’t tell which creative or audience actually drove a click-out, which makes every later optimization a guess.
Confusing an ad read with a financial read. Assuming ad spend will recoup quickly through royalties leads artists to pull budget from campaigns that are actually working, just slower than expected on the revenue side.
No declared attribution window. Without one, every stakeholder ends up arguing about whether the campaign worked using a different, informal timeline.
Ignoring geography and demographic splits. A blended report can hide a single underperforming segment dragging down otherwise solid numbers.
Fixing these usually costs nothing but a spreadsheet habit and a little patience before calling a verdict.
Twisby Records’ Approach to Campaign Reporting
The team has extensive experience mixing and mastering independent music, and its certification reflects attention to detail it brings to advertising reports. In practice, that means reading a campaign twice: once at the ad level, once at the streaming level, before recommending any change. One recurring pattern: a client’s ad creative pulled cheap clicks but a weak save rate, and shifting the message toward the song’s hook rather than the artist’s image doubled the save rate within two weeks. Another campaign showed strong streams-per-listener in a single overlooked metro market, and reallocating spend there outperformed the original national targeting.
— Kreg
Twisby Records: Managed Reporting and Advertising for Independent Artists
Some services offer to set up smart links, merge ad and streaming data, and provide reports that tell you what to change.
Some providers run the full stack described in this guide, including managed Facebook and Instagram ad campaigns, smart-link setup, custom landing pages, audience research, and the daily merge work that turns raw numbers into a decision. For a DIY artist juggling mixing sessions, social posts, and a day job, this can save real hours every week and remove the guesswork of interpreting cost-per-save and streams-per-listener alone. These providers also may handle mixing and mastering, including certified delivery, so the campaign and recording promoting come from the same team. Check out the advertising services page to see current packages and get a quote for your next release.
Primary Sources and Tools
- SiriusXM Media on attribution windows — why 30 to 90-day windows matter.
- Soundlink’s marketing funnel guide — smart-link attribution basics.
- MusicPulse’s ROI tracking guide — tiered ROI and cost benchmarks.
- VLVTN’s ad ROI math — break-even and payout modeling.
Sources
- Finding the right attribution window for digital audio ads | SiriusXM Media
- Music Marketing Funnel 101: How to Measure Spotify Promotion Like a Pro | Soundlink
- Are Music Ads Worth It? The Real ROI Math (2026) | VLVTN
FAQ
What Is a Good Save Rate for a Music Ad Campaign?
There’s no single universal number, since save rate varies by genre and platform, but a rising save rate relative to your own past campaigns is a stronger signal than any outside benchmark.
How Long Should I Wait Before Judging a Campaign?
Run an early ad read at 7 days, a real postmortem at 30 days, and an algorithmic review at 60 days, since algorithmic effects often peak two to four weeks after spend stops.
What’s the Difference Between CPL, CPSave, and CPS?
Cost per listener (CPL) measures spend against unique listeners, cost per save (CPSave) measures spend against saves, and cost per stream (CPS) measures spend against total plays. CPSave is generally the strongest quality signal of the three.
Do I Need a Smart Link for Campaign Reporting?
A smart link creates the attribution step between an ad click and the streaming platform, which is difficult to reconstruct accurately without one.
Can Twisby Records Handle My Campaign Reporting for Me?
Yes. Twisby Records runs managed ad campaigns, smart-link setup, and reporting merges for independent artists through its advertising services.