

TL;DR:
- Chartmetric excels in artist discovery and cross-territory trend analysis with a focus on A&R. Soundcharts specializes in radio monitoring, team collaboration, and scheduled reports for label and promo teams. Indie artists should start with free tools like Spotify for Artists and evaluate paid platforms as their release needs grow.
If you’re in A&R or talent discovery, Chartmetric is your platform. If you run a label, manage a roster, or need radio monitoring with scheduled reporting, Soundcharts is the stronger fit. For indie artists who need mobile push alerts without a steep learning curve, Songstats covers the essentials. The role-based comparison across all platforms makes this clear: Chartmetric leans discovery and A&R, Soundcharts leans monitoring and team reporting, and Songstats leans real-time alerts and mobile-first tracking.
TL;DR by role:
- A&R / talent scout: Start a Chartmetric demo, bring a target genre and territory to test discovery filters.
- Label analytics / roster monitoring: Request a Soundcharts onboarding demo and ask specifically about radio coverage and scheduled report setup.
- Manager / promo team: Soundcharts for airplay tracking and client-facing reports; Songstats as a lightweight complement for real-time alerts.
- Indie artist: Songstats free tier or Spotify for Artists first, then evaluate paid tools when your release schedule justifies the cost.
- Enterprise / high-fidelity data: Luminate Data for industry-scale measurement; SymphonyOS for complex label governance workflows.
Pro Tip: Before committing to any paid plan, run a two-week pilot using your own artist roster or a recent release. Compare what the platform shows against your Spotify for Artists dashboard to spot gaps in data coverage before you sign.
Table of Contents
- Chartmetric vs Soundcharts: side-by-side feature comparison
- What Chartmetric does best and who should use it
- What Soundcharts does best and who should use it
- How do pricing and trials compare across these platforms?
- What data do these platforms actually track, and how fresh is it?
- How do integrations, APIs, and reporting workflows differ?
- How do you choose the right platform for your workflow?
- What does onboarding and support actually look like?
- Final recommendation by role
- Key Takeaways
- The gap between analytics and execution
- Twisbyrecords handles the execution side of analytics-driven campaigns
- Useful sources
- FAQ
Chartmetric vs Soundcharts: side-by-side feature comparison
The table below covers all eleven platforms across the dimensions that actually drive buying decisions. Platform-native tools like Spotify for Artists and YouTube for Artists are free and worth stacking alongside any paid platform for direct attribution data.
| Platform | Best for | Data sources & coverage | Refresh rate / alerts | Playlist & editorial detection | Airplay / radio | Reporting & team features | API access | Ease of use | Pricing & trial |
|---|---|---|---|---|---|---|---|---|---|
| Chartmetric | A&R, talent discovery, cross-territory trend analysis | Streaming, playlists, social (TikTok, IG, YouTube), Shazam, charts | Near real-time; time-series API | Strong: curator tracking, editorial detection | Limited | Dashboard exports; less team-workflow focus | Time-series API; normalized schema | Data-dense; steeper learning curve | Tiered; higher cost for full access; demo available |
| Soundcharts | Labels, managers, promo teams, roster monitoring | Streaming, playlists, radio/airplay, social, charts | Near real-time; scheduled reporting | Good playlist monitoring | Deep: broad territory radio coverage | Shared dashboards, task assignment, client-facing reports, RBAC | API-first provisioning; scheduled syncs | Clean team UI; moderate learning curve | Tiered; enterprise quotes; demo available |
| Songstats | Indie artists, fast-response promo teams | Streaming, playlists, social | Real-time push alerts | Playlist adds | Limited | Basic; mobile-first | Limited | Mobile-friendly; low barrier | Free tier + paid plans |
| Viberate | Chart browsing, accessible overviews | Streaming, charts, social | Moderate | Curated lists | Limited | Basic | Limited | Very accessible | Free chart access + paid tiers |
| artist.tools | Artists and managers needing simple insights | Streaming, basic social | Moderate | Basic | None listed | Basic | Limited | Simple | Not publicly listed |
| Spot On Track | Playlist pitching teams, curators | Playlists, editorial detection | Near real-time for playlists | Focused and deep | None | Basic | Limited | Focused; easy | Tiered |
| Spotify for Artists | Spotify-native attribution | Spotify only | Real-time | Spotify editorial playlists | None | Basic artist dashboard | None (platform-native) | Very easy | Free |
| YouTube for Artists | YouTube performance, video audience signals | YouTube only | Real-time | None | None | Basic video analytics | None (platform-native) | Very easy | Free |
| SymphonyOS | Large labels, enterprise governance | Streaming, social, playlists | Scheduled | Good | Limited | Enterprise dashboards, governance | Enterprise API | Complex; enterprise-grade | Enterprise quotes |
| Beatchain | Fan engagement + campaign tracking | Streaming, fan data, rights metadata | Moderate | Campaign-level | None | Campaign + fan engagement tools | Limited | Moderate | Tiered |
| Luminate Data | Industry-scale measurement, enterprise reporting | Industry datasets, streaming, radio, retail | Batch/scheduled | Limited | Broad radio/airplay | Enterprise reporting | Enterprise API | Complex; analyst-grade | Enterprise quotes; no self-serve |
Two differences stand out above everything else in the Chartmetric vs Soundcharts comparison.
Chartmetric’s normalized time-series schema means you can query artist and release data across territories in a consistent format, which is what makes it useful for A&R pipelines and cross-market trend analysis. The time-series API tied to a normalized schema for artists, releases, and territories is the feature that separates it from monitoring-first tools.
Soundcharts takes the opposite approach: API-first provisioning of chart entities and scheduled reporting runs, with governance controls built for multi-person teams. That architecture is what makes it the right call for labels running weekly roster reports or promo teams tracking radio spins across territories.
Where platform-native tools fit: Spotify for Artists and YouTube for Artists are free and give you direct, unmediated attribution data. Neither replaces a third-party analytics platform, but both are the right baseline for validating what paid tools report.
What Chartmetric does best and who should use it
Chartmetric’s core strength is discovery. The platform’s filtering tools let A&R teams search across genres, territories, and growth trajectories to surface artists before they break. Playlist intelligence goes deep: you can track curator behavior, see which playlists an artist has been added to or dropped from, and map editorial playlist velocity over time. That level of granularity is genuinely useful for pitching strategy at scale.
The normalized time-series schema is the technical backbone. Every artist, release, and territory maps to a consistent data structure, so automated queries into BI dashboards or internal reporting tools produce clean, comparable outputs. For a label analytics team running cross-territory trend analysis, that consistency matters.
Chartmetric strengths:
- Discovery filters by genre, territory, growth rate, and social momentum
- Playlist intelligence: curator tracking, editorial detection, add/drop history
- Normalized chart time-series API for automated reporting
- Historical depth across streaming, social, Shazam, and chart sources
- Strong for cross-territory A&R pipelines
Tradeoffs to know:
- The UI is data-dense; new users typically need a few weeks to build efficient workflows
- Full chart access sits at a higher price point than some alternatives
- Less emphasis on radio/airplay monitoring compared to Soundcharts
- Team collaboration features are lighter than what Soundcharts offers
The right next step is a discovery filter demo using a real target genre and territory. Bring a shortlist of artists you’re already tracking and test how the platform surfaces comparable emerging acts.
What Soundcharts does best and who should use it
Soundcharts is built for operations, not exploration. The platform’s radio and airplay monitoring covers a broad range of territories with near real-time updates, which is the feature most label promo teams can’t get elsewhere at this depth. If you need to know when a track gets spun on a regional station in a secondary market, Soundcharts is the tool that surfaces it.
The team workflow architecture is equally strong. Shared dashboards, task assignment, role-based access controls, and client-facing report templates are all built in. A manager running a three-artist roster can set up automated weekly reports for each artist and share them directly with clients without exporting to a spreadsheet. That kind of repeatable reporting workflow is what the API-first provisioning and scheduled chart reporting runs are designed to support.
Soundcharts also has an iOS app in the App Store, so monitoring and alerts aren’t limited to desktop.
Soundcharts strengths:
- Deep radio/airplay monitoring across many territories
- Near real-time updates for chart and airplay sources
- Shared dashboards, task assignment, and RBAC for team workflows
- Scheduled reporting and client-facing report templates
- API-first provisioning for governance and automation
Tradeoffs to know:
- Discovery filtering is less granular than Chartmetric’s
- Configuration is bounded by the published schema; nonstandard internal metrics require workarounds
- Pricing scales with team size and data access; enterprise quotes required for full access
Request an onboarding demo and specifically ask the sales team to walk through radio monitoring setup and a sample scheduled report. That’s where the platform’s real operational value shows up.
How do pricing and trials compare across these platforms?
Pricing across this category follows two broad shapes: tiered per-seat plans with database access gating, and enterprise custom quotes. Here’s what to expect from each major option.
Tiered self-serve plans:
- Chartmetric — gates full chart and historical data access behind higher tiers. Full access can be costly relative to alternatives, though a demo is available and lower tiers cover basic discovery use cases.
- Soundcharts — offers tiered plans scaling with team size and data volume; enterprise arrangements require a custom quote.
- Songstats — has a free tier that covers basic streaming and playlist monitoring, making it the lowest-friction entry point for indie artists.
- Viberate — offers free chart browsing with paid tiers for deeper data access.
- Beatchain offers tiered plans combining campaign and fan engagement features.
Enterprise / custom pricing:
- SymphonyOS and Luminate Data both require enterprise quotes. Neither offers a self-serve free tier. Luminate Data is not a self-serve product at all; it’s an industry measurement service used by labels, distributors, and trade publications.
- artist.tools does not publicly list pricing.
Free platform-native options:
Spotify for Artists and YouTube for Artists are free. For an indie artist or small team, these two tools cover a significant portion of what a paid platform provides, specifically direct streaming attribution and audience demographics. The gap shows up when you need cross-platform aggregation, radio monitoring, or team reporting.
Practical guidance: A discovery-focused A&R team likely needs Chartmetric’s mid-to-upper tier to access full historical data and API endpoints. A monitoring-focused label team needs Soundcharts at a team plan level to unlock RBAC and scheduled reporting. If your primary need is playlist alerts, Songstats’ paid tier or Spot On Track is a more cost-efficient path than paying for a full Chartmetric or Soundcharts subscription.
What data do these platforms actually track, and how fresh is it?
All three major platforms (Chartmetric, Soundcharts, Songstats) aggregate streaming, social, and playlist data into a single dashboard. The differences are in emphasis, depth, and refresh cadence.
| Platform | Streaming | Playlists | Radio / Airplay | Social (TikTok, IG, YouTube) | Shazam | Historical depth | Refresh cadence |
|---|---|---|---|---|---|---|---|
| Chartmetric | Yes | Deep (editorial + user) | Limited | Yes | Yes | Deep | Near real-time to daily |
| Soundcharts | Yes | Good | Deep (multi-territory) | Yes | Limited | Good | Near real-time |
| Songstats | Yes | Good | Limited | Yes | Limited | Moderate | Real-time push alerts |
| Viberate | Yes | Curated lists | Limited | Yes | No | Moderate | Moderate |
| Spot On Track | Limited | Deep (editorial focus) | No | No | No | Moderate | Near real-time for playlists |
| Luminate Data | Yes | Limited | Broad (industry-grade) | Limited | No | Deep (industry) | Batch / scheduled |
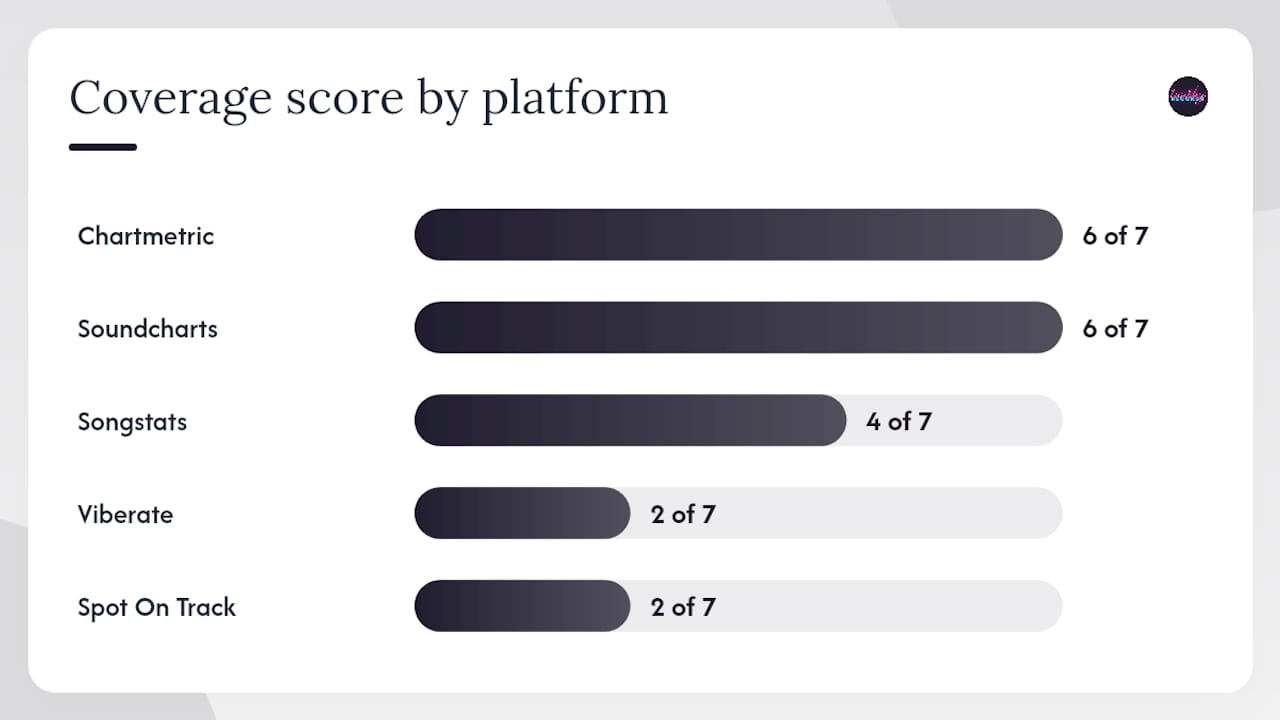
Soundcharts monitors performance across major digital platforms and radio with near real-time updates and broad country coverage. Chartmetric offers deep historical charting, though full access comes at a higher price point than some alternatives.
Data provenance matters more than most buyers realize. Vendor-stated coverage lists describe what a platform can track, not necessarily what it tracks for every territory or every chart source at the same refresh rate. A platform may list 50 countries for radio monitoring but deliver near real-time data for only the top 10 markets.
Pro Tip: Validate playlist and curator data against your Spotify for Artists dashboard and request a sample API pull during vendor demos to check refresh cadence and schema compatibility before signing.
How do integrations, APIs, and reporting workflows differ?
The architecture difference between Chartmetric and Soundcharts shows up most clearly in how each platform handles automation.
Chartmetric’s time-series API is query-first: you pull normalized artist and release data into your own BI tool, dashboard, or internal system. That’s powerful for A&R teams building custom discovery pipelines or label analytics teams feeding data into Tableau or Looker. The tradeoff is that you need someone technical enough to build and maintain those queries.
Soundcharts uses an API-first provisioning model: you configure chart entities and reporting schedules through the API, and the platform handles the scheduled delivery. That’s a better fit for operations teams that need repeatable, governed outputs without writing custom queries every time. RBAC controls mean you can give clients or junior team members access to specific dashboards without exposing the full data set.
Common integration patterns:
- Label analytics teams: — Chartmetric API into Tableau or Looker for cross-territory trend dashboards; Soundcharts scheduled reports for weekly roster monitoring delivered to A&R and management.
- Indie artists: — Spotify for Artists as the primary free tool; Songstats for cross-platform mobile alerts; smart link platforms for tracking fan conversion from campaigns.
When you’re thinking about how analytics connect to campaign execution, the link between data and action matters. A smart link or landing page tied to a release campaign gives you conversion data that complements what streaming analytics show. That’s a different layer from what Chartmetric or Soundcharts tracks, but it’s part of the same picture. For context on how smart links compare to standard landing pages for musicians, the mechanics of fan conversion are worth understanding alongside platform analytics.
How do you choose the right platform for your workflow?
The right platform is the one that matches your primary workflow, not the one with the longest feature list. Here’s a practical framework.
- Define your primary workflow first. Are you discovering new artists (A&R), monitoring an existing roster (label/manager), tracking radio spins (promo), or watching your own release metrics (indie artist)? The answer eliminates most options immediately.
- List your required integrations. Does the platform need to feed data into an existing BI tool? Does your team use Slack for alerts? Does your client portal need white-label reports? Confirm API endpoint availability before the demo.
- Determine your reporting cadence. Daily radio alerts require near real-time refresh. Weekly roster reports can run on scheduled exports. Monthly executive dashboards can use batch data. Match the platform’s refresh architecture to your actual cadence.
- Map your team size and permissions needs. A solo manager needs a simple dashboard. A label team needs RBAC, shared workspaces, and audit trails. Enterprise operations need governance controls.
- Set a realistic budget. Full API access and historical data depth cost more on every platform. Know which features you actually need before pricing conversations.
- Run a two-week pilot with real data. Bring your own artist roster or a recent release. Test the specific workflows you’ll use daily, not the demo scenarios the vendor shows you.
Questions to ask during vendor demos:
- Which API endpoints are available at my plan level, and what are the rate limits?
- What is the actual data latency for radio monitoring in my target territories?
- How does your platform detect editorial playlist adds, and how do you validate that methodology?
- How far back does historical data go for streaming and chart sources?
- What is your support SLA for API issues and data discrepancies?
Red flags to watch for:
- Vague answers about data provenance or coverage methodology
- No API access at the plan level you’re evaluating
- Inconsistent refresh rates across territories without clear documentation
- No export or white-label options for client reporting
- Demo data that doesn’t match what you see in Spotify for Artists for the same artist
Third-party buyer guides consistently recommend validating vendor coverage claims during demos rather than accepting stated coverage lists at face value. Build that verification step into every evaluation.
What does onboarding and support actually look like?
Onboarding timelines vary significantly between self-serve and enterprise tiers.
Small teams and indie artists (1–3 users):
- Chartmetric and Soundcharts both offer self-serve onboarding with documentation and video resources.
- Expect 1–2 weeks to build efficient workflows from scratch.
- Songstats and Viberate have lower setup friction; most users are functional within a day.
- Platform-native tools (Spotify for Artists, YouTube for Artists) require no onboarding.
Label and agency teams (4–20 users):
- Soundcharts typically assigns a dedicated onboarding contact for team plans.
- Expect 2–4 weeks to configure RBAC, set up scheduled reports, and integrate with existing workflows.
- Chartmetric’s API setup for BI tool integration may require a technical resource on your side.
Enterprise customers:
- SymphonyOS and Luminate Data both involve structured onboarding with account management, data mapping sessions, and governance configuration.
- Timelines typically run 4–8 weeks for full deployment.
What to request during a pilot:
- A sample automated report delivered on your actual schedule (weekly, daily)
- Access to an API sandbox with real endpoints, not just documentation
- Documented SLAs for data refresh, support response, and incident resolution
- A walkthrough of how data discrepancies are flagged and resolved
Support models range from community docs and email tickets (lower tiers) to dedicated account managers and success resources (enterprise). Soundcharts’ team workflow features, including shared dashboards and task assignment, reduce the support burden for multi-person operations because team members can self-serve within their permission level.
Final recommendation by role
The Chartmetric vs Soundcharts decision comes down to one question: are you primarily discovering artists or monitoring them?
Pick Chartmetric if:
- You’re in A&R or talent scouting and need discovery filters across genres and territories.
- Your team builds automated pipelines using a normalized time-series API.
- Playlist intelligence and curator behavior tracking are central to your workflow.
Pick Soundcharts if:
- You run a label, manage a roster, or lead a promo team that needs radio monitoring.
- You need scheduled reporting, client-facing dashboards, and RBAC for a multi-person team.
- Airplay tracking across multiple territories is a core requirement.
Pick Songstats if:
- You’re an indie artist or small promo team that needs real-time mobile alerts without enterprise complexity.
For enterprise and industry-scale needs:
- SymphonyOS for complex label governance and high-volume reporting.
- Luminate Data for industry-level measurement and market datasets.
Immediate next steps:
- A&R teams: book a Chartmetric discovery demo; bring a target genre, two territories, and a shortlist of artists to test filters against.
- Label/promo teams: request a Soundcharts onboarding demo; ask specifically for a live radio monitoring walkthrough and a sample scheduled report.
- Indie artists: activate Spotify for Artists and YouTube for Artists today (both free), then evaluate Songstats once you have a release in market.
- Teams considering a dual-tool approach: some enterprise operations run Chartmetric for discovery and Soundcharts for monitoring in parallel, which adds cost but avoids compromising on either workflow.
For teams that want analytics insights translated directly into campaign execution, a music release strategy that connects data to promotional timing is worth building before you commit to a platform.
Key Takeaways
Chartmetric wins for discovery and A&R; Soundcharts wins for monitoring, radio tracking, and team reporting; the right choice depends entirely on your primary workflow, not feature count.
| Point | Details |
|---|---|
| Role drives the decision | Chartmetric fits A&R and discovery; Soundcharts fits labels, managers, and promo teams needing radio monitoring and scheduled reporting. |
| API architecture matters | Chartmetric’s query-first time-series API suits custom BI pipelines; Soundcharts’ API-first provisioning suits scheduled, governed reporting operations. |
| Validate before you buy | Cross-check vendor coverage claims against Spotify for Artists during a two-week pilot before committing to any paid plan. |
| Free tools are a real baseline | Spotify for Artists and YouTube for Artists are free, platform-native, and worth stacking alongside any paid analytics tool for direct attribution. |
| Twisbyrecords as managed alternative | For independent artists who want analytics-driven campaign execution without managing a platform, Twisbyrecords offers managed advertising and landing page services that translate data into action. |
The gap between analytics and execution
There’s a version of this conversation that never gets said out loud: most independent artists and small management teams buy an analytics platform, spend two weeks learning it, and then don’t change anything about how they run campaigns. The data sits in dashboards. The releases go out the same way they always did.
That’s not a knock on the platforms. Chartmetric and Soundcharts are genuinely good tools. But analytics only matter when someone acts on them, and acting on them requires time, a clear workflow, and the ability to connect what the data shows to what you actually do next.
The teams that get real value from these platforms are the ones who already have a process. They know what they’re looking for before they open the dashboard. They have a release calendar, a promotional budget, and a clear idea of which territories they’re targeting. The platform confirms or challenges their assumptions; it doesn’t replace the strategy.
For an indie artist working without a label or a dedicated analyst, the honest answer is often that Spotify for Artists plus a well-structured release plan covers 80% of what a paid platform would show you. The remaining 20%, specifically radio monitoring, cross-platform aggregation, and curator tracking, matters more as your release volume and team size grow.
The tools in this comparison are worth the investment when you’re ready to act on what they tell you. If you’re still figuring out your release strategy or building your first real promotional workflow, start there. The tactics for increasing Spotify streams that actually move numbers are grounded in execution, not just observation.
Twisbyrecords handles the execution side of analytics-driven campaigns
Analytics tell you where the opportunity is. Getting there requires a different kind of work: ad creative, targeting, landing pages, and optimization across a release cycle. That’s where most independent artists and small teams run out of bandwidth.
Twisbyrecords offers managed advertising campaigns for music releases, including audience research, Facebook and Instagram ad setup, custom landing pages, and ongoing optimization. You bring the analytics insight; Twisbyrecords handles the campaign execution. There’s no need to manage a platform subscription, interpret ad data, or rebuild targeting from scratch for every release.
For teams that want a smart link or landing page that converts listeners into fans, Twisbyrecords’ links and landing page service pairs directly with analytics-led release campaigns. If you’ve identified the right audience through Chartmetric or Soundcharts and want someone to build and run the campaign that reaches them, get in touch with Twisbyrecords to discuss your next release.
Useful sources
These primary sources are worth bookmarking for vendor verification and ongoing comparison research.
- Best Music Charting Software – 2026 Buyer’s Guide
- Chartmetric vs Soundcharts vs Songstats Compared | Orphiq
- Top Music Charts: Chartmetric vs Viberate vs Soundcharts
- apps.apple.com
- Soundcharts vs Chartmetric 2026: Best Analytics for Artists – Ones To Watch
How to use these sources: Cross-check any vendor’s stated coverage list against what you see in Spotify for Artists for an artist you already know well. If the numbers diverge significantly, ask the vendor to explain the methodology before you commit.
FAQ
Is Chartmetric or Soundcharts better for A&R?
Chartmetric is the stronger choice for A&R. Its discovery filters, normalized time-series API, and playlist intelligence tools are built specifically for finding and tracking emerging artists across territories.
Does Soundcharts have a mobile app?
Yes. Soundcharts has an iOS app available in the App Store, supporting mobile monitoring and alert delivery for teams that need updates away from desktop.
Can indie artists use these platforms without a label budget?
Songstats offers a free tier, and both Spotify for Artists and YouTube for Artists are free. Chartmetric and Soundcharts are priced for professional teams; indie artists should start with free tools and evaluate paid options once release volume justifies the cost.
What is the difference between a smart link and a standard landing page for music?
A smart link routes fans to their preferred streaming platform from a single URL and tracks which platform they choose, giving you conversion data by platform. A standard landing page is a fixed destination without that routing or tracking layer.
Should I use Chartmetric and Soundcharts together?
Some enterprise label teams run both in parallel: Chartmetric for discovery and A&R, Soundcharts for roster monitoring and reporting. That adds cost but avoids compromising on either workflow. For most teams, picking the platform that matches your primary workflow is the more practical starting point.